Plotting your own data onto a map is in great demand for businesses and individuals. Either to show each location details in an Infowindow or for filtering over the map based on several conditions, but also to find locations within a distance to a place and ultimately to calculate the optimal route directions for your next travel around.
For the first time, the Mapping Sheets add-on is providing an easy way to process your data directly from Google Sheets onto a map.
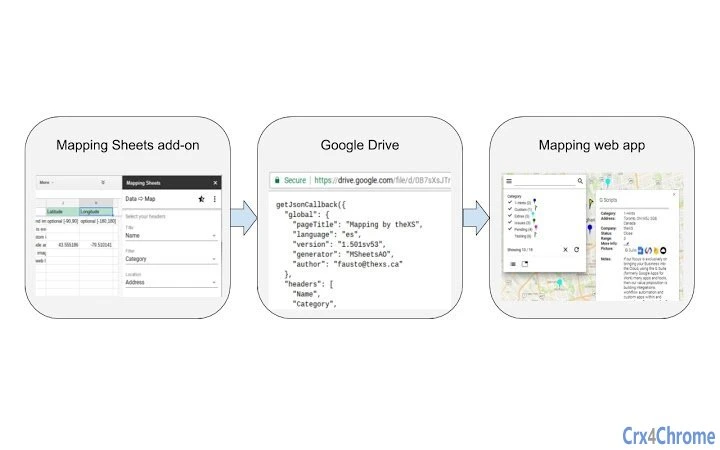
First BUILD: the Mapping Sheets add-on will process your data from Google Sheets and create a .json file in your Google Drive, ready for mapping. Then VIEW: the Mapping web app will gather that .json file and plot your data directly onto a map. You can get your data from Google Sheets and onto a Google Map in just a few clicks.
➡ Mapping Sheets add-on
A Google Sheets add-on available within your own Spreadsheets under the Add-ons menu
⇨ Plans and Features
■ Basic Free Plan: Up to 50 locations per map. Includes all the basic (−) features.
■ Advanced Premium Plan (†): No restrictions in the number of locations per map. Includes all the basic (−) and advanced (+) features.
(†) Disclaimer: The Advanced Premium Plan does not avoid service errors, limitations and quotas like Google Geocoding daily quota limit exception, etc.
⇨ Getting started with your data on Google Sheets
■ Enter all your data for mapping onto a sheet, or insert a demo sheet from the ⋮ menu
■ Select the 3 column headers you want to use for Title, Filter, and Location when building the map
■ Click BUILD to process your data into a .json file in your Google Drive, ready for mapping
■ Click VIEW to open the Mapping web app and see all your locations on a Google Map
■ Check the User Preferences for more options and settings
➡ Mapping web app
A generic data driven web app using Google Maps that loads data and settings from a .json file in your Google Drive.
The Mapping web app is free to access, publicly available with no fee, no credentials are required for access, for anyone to use.
➡ Main features (add-on and web-app)
⇨ Basic Features:
− Select the 3 data headers you want to use for Title, Filter, and Location
− The Title determines the value of the header in the Infowindow
− The Location (address) is used for Geocoding to get the coordinates on the map
− The Filter will group mapping locations using the same icon image
− Define a Location Template for Geocoding, using placeholders for headers, if the full address is split across several columns
− Include additional columns to display more information on the map
− Set the optional data headers row in case it's not the row #1 as default
− Use default icons and colors, or assign your own icons and colors to each filter unique value
− Select custom data to show in the icon title (mouseover tooltip) based on a template string
− Click a marker icon to open an Infowindow showing all the details of a specific location
− Select the data to display in the Infowindow based on a list of your headers
− Use image file secure urls (https:// ending on jpg, gif, png, svg) to show an image in the Infowindow
− Use valid urls to show links (...⬈) in the Infowindow
− Select custom data to show in the right-side Listing, based on a template string
− Access some extra actions in the add-on sidebar ⋮ menu
− Using Marker Clusters to combine markers of close proximity into clusters, for better performance and navigation
− Optional cluster settings for size, zoom and an [experimental] toggle button to hide/show clusters as convenient
− Spreading out overlapping location icons on click, in a spider-like approach
− Instantly filter across the entire data content as you type in the search box
− Use check-boxes for easy grouping and filtering locations according to the main filter
− Fast filtering by using a debounce asynchronous function, that wait/queue user's requests on filtering
− Choose to fit the zoom and center of the map to show selected locations
− Show or hide the right-side Listing of selected locations
− Available in more than 30 languages (add-on only, thanks to all the translators, including Google Translate 😉 )
− Take advantage of the many more features provided by Google Maps
⇨ Premium Features:
+ Additional filters including check-boxes and numeric sliders
+ Use additional filters in combination with the main filter to show selected locations
+ Filtering within a section works with “inclusive or” logic
+ Filtering across sections works with “and” logic
+ Find a place, draw a circle around, with option to filter locations within its boundaries
+ Optional quantity tags next to each filter value
+ Show one filter value per line (optional)
+ Use optional multi-value filter (with your own custom separator)
+ Filter for a value greater than a number, like a standard slider with the active section on the right
+ Choose to hide the filter menu on loading the map
+ Custom Mapping web app page title
+ Select an icon set from a list of available options
+ Set and apply a custom style definition for your map, with thousands available online
+ Optimal route with options for round trip and start/end locations on Listing
+ Allows for custom code on post-processing Data, Infowindow and Locations List
+ More features in the queue already under development (see the Roadmap)
➡ Relevant links and references
+ Get the add-on from G Suite Marketplace
+ FAQ, Feedback, and Support
https://www.thexs.ca/xsmapping/faq-and-feedback
+ Limitations, Known Issues and Common Errors
https://www.thexs.ca/xsmapping/limitations-known-issues-and-common-errors
+ New Features Roadmap
https://www.thexs.ca/xsmapping/new-features-roadmap
+ Current (out of date) Mapping Sheets add-on Reference document
https://thexs.page.link/3EvT
+ Advanced Premium Plan subscription
https://www.thexs.ca/xsmapping/advanced-premium-plan-subscription
+ User Preferences and Settings
https://www.thexs.ca/xsmapping/mapping-sheets-add-on-preferences
+ Privacy, TOS, SLA and Liability
https://www.thexs.ca/about-thexs/legalese
+ Demo map with most of the Advanced Premium Features
https://thexs-mapping.firebaseapp.com/mapping.html
For the first time, the Mapping Sheets add-on is providing an easy way to process your data directly from Google Sheets onto a map.
First BUILD: the Mapping Sheets add-on will process your data from Google Sheets and create a .json file in your Google Drive, ready for mapping. Then VIEW: the Mapping web app will gather that .json file and plot your data directly onto a map. You can get your data from Google Sheets and onto a Google Map in just a few clicks.
➡ Mapping Sheets add-on
A Google Sheets add-on available within your own Spreadsheets under the Add-ons menu
⇨ Plans and Features
■ Basic Free Plan: Up to 50 locations per map. Includes all the basic (−) features.
■ Advanced Premium Plan (†): No restrictions in the number of locations per map. Includes all the basic (−) and advanced (+) features.
(†) Disclaimer: The Advanced Premium Plan does not avoid service errors, limitations and quotas like Google Geocoding daily quota limit exception, etc.
⇨ Getting started with your data on Google Sheets
■ Enter all your data for mapping onto a sheet, or insert a demo sheet from the ⋮ menu
■ Select the 3 column headers you want to use for Title, Filter, and Location when building the map
■ Click BUILD to process your data into a .json file in your Google Drive, ready for mapping
■ Click VIEW to open the Mapping web app and see all your locations on a Google Map
■ Check the User Preferences for more options and settings
➡ Mapping web app
A generic data driven web app using Google Maps that loads data and settings from a .json file in your Google Drive.
The Mapping web app is free to access, publicly available with no fee, no credentials are required for access, for anyone to use.
➡ Main features (add-on and web-app)
⇨ Basic Features:
− Select the 3 data headers you want to use for Title, Filter, and Location
− The Title determines the value of the header in the Infowindow
− The Location (address) is used for Geocoding to get the coordinates on the map
− The Filter will group mapping locations using the same icon image
− Define a Location Template for Geocoding, using placeholders for headers, if the full address is split across several columns
− Include additional columns to display more information on the map
− Set the optional data headers row in case it's not the row #1 as default
− Use default icons and colors, or assign your own icons and colors to each filter unique value
− Select custom data to show in the icon title (mouseover tooltip) based on a template string
− Click a marker icon to open an Infowindow showing all the details of a specific location
− Select the data to display in the Infowindow based on a list of your headers
− Use image file secure urls (https:// ending on jpg, gif, png, svg) to show an image in the Infowindow
− Use valid urls to show links (...⬈) in the Infowindow
− Select custom data to show in the right-side Listing, based on a template string
− Access some extra actions in the add-on sidebar ⋮ menu
− Using Marker Clusters to combine markers of close proximity into clusters, for better performance and navigation
− Optional cluster settings for size, zoom and an [experimental] toggle button to hide/show clusters as convenient
− Spreading out overlapping location icons on click, in a spider-like approach
− Instantly filter across the entire data content as you type in the search box
− Use check-boxes for easy grouping and filtering locations according to the main filter
− Fast filtering by using a debounce asynchronous function, that wait/queue user's requests on filtering
− Choose to fit the zoom and center of the map to show selected locations
− Show or hide the right-side Listing of selected locations
− Available in more than 30 languages (add-on only, thanks to all the translators, including Google Translate 😉 )
− Take advantage of the many more features provided by Google Maps
⇨ Premium Features:
+ Additional filters including check-boxes and numeric sliders
+ Use additional filters in combination with the main filter to show selected locations
+ Filtering within a section works with “inclusive or” logic
+ Filtering across sections works with “and” logic
+ Find a place, draw a circle around, with option to filter locations within its boundaries
+ Optional quantity tags next to each filter value
+ Show one filter value per line (optional)
+ Use optional multi-value filter (with your own custom separator)
+ Filter for a value greater than a number, like a standard slider with the active section on the right
+ Choose to hide the filter menu on loading the map
+ Custom Mapping web app page title
+ Select an icon set from a list of available options
+ Set and apply a custom style definition for your map, with thousands available online
+ Optimal route with options for round trip and start/end locations on Listing
+ Allows for custom code on post-processing Data, Infowindow and Locations List
+ More features in the queue already under development (see the Roadmap)
➡ Relevant links and references
+ Get the add-on from G Suite Marketplace
+ FAQ, Feedback, and Support
https://www.thexs.ca/xsmapping/faq-and-feedback
+ Limitations, Known Issues and Common Errors
https://www.thexs.ca/xsmapping/limitations-known-issues-and-common-errors
+ New Features Roadmap
https://www.thexs.ca/xsmapping/new-features-roadmap
+ Current (out of date) Mapping Sheets add-on Reference document
https://thexs.page.link/3EvT
+ Advanced Premium Plan subscription
https://www.thexs.ca/xsmapping/advanced-premium-plan-subscription
+ User Preferences and Settings
https://www.thexs.ca/xsmapping/mapping-sheets-add-on-preferences
+ Privacy, TOS, SLA and Liability
https://www.thexs.ca/about-thexs/legalese
+ Demo map with most of the Advanced Premium Features
https://thexs-mapping.firebaseapp.com/mapping.html